Press releases say what was announced.Quarterly passes show what was built.

Port Monitoring compares each new satellite pass of a port with the last one and marks the reclaimed area, berth line and spoil ground that changed.

GSD
0.5–2 m (high-res)
Cadence
Quarterly
Platform
High-res satellite
Spectral
RGB

Where the register runs out

Your register of berth, reclamation and dredging projects comes mostly from the operator's press releases, annual report and master plan. They tell you what was announced. A site visit tells you what stood there on one day, at one port.

In between, a phase can be reported done while the quay line has not moved, and you find out at the next visit or when the next tender lands. Most ports on your list get no visit in a given quarter.
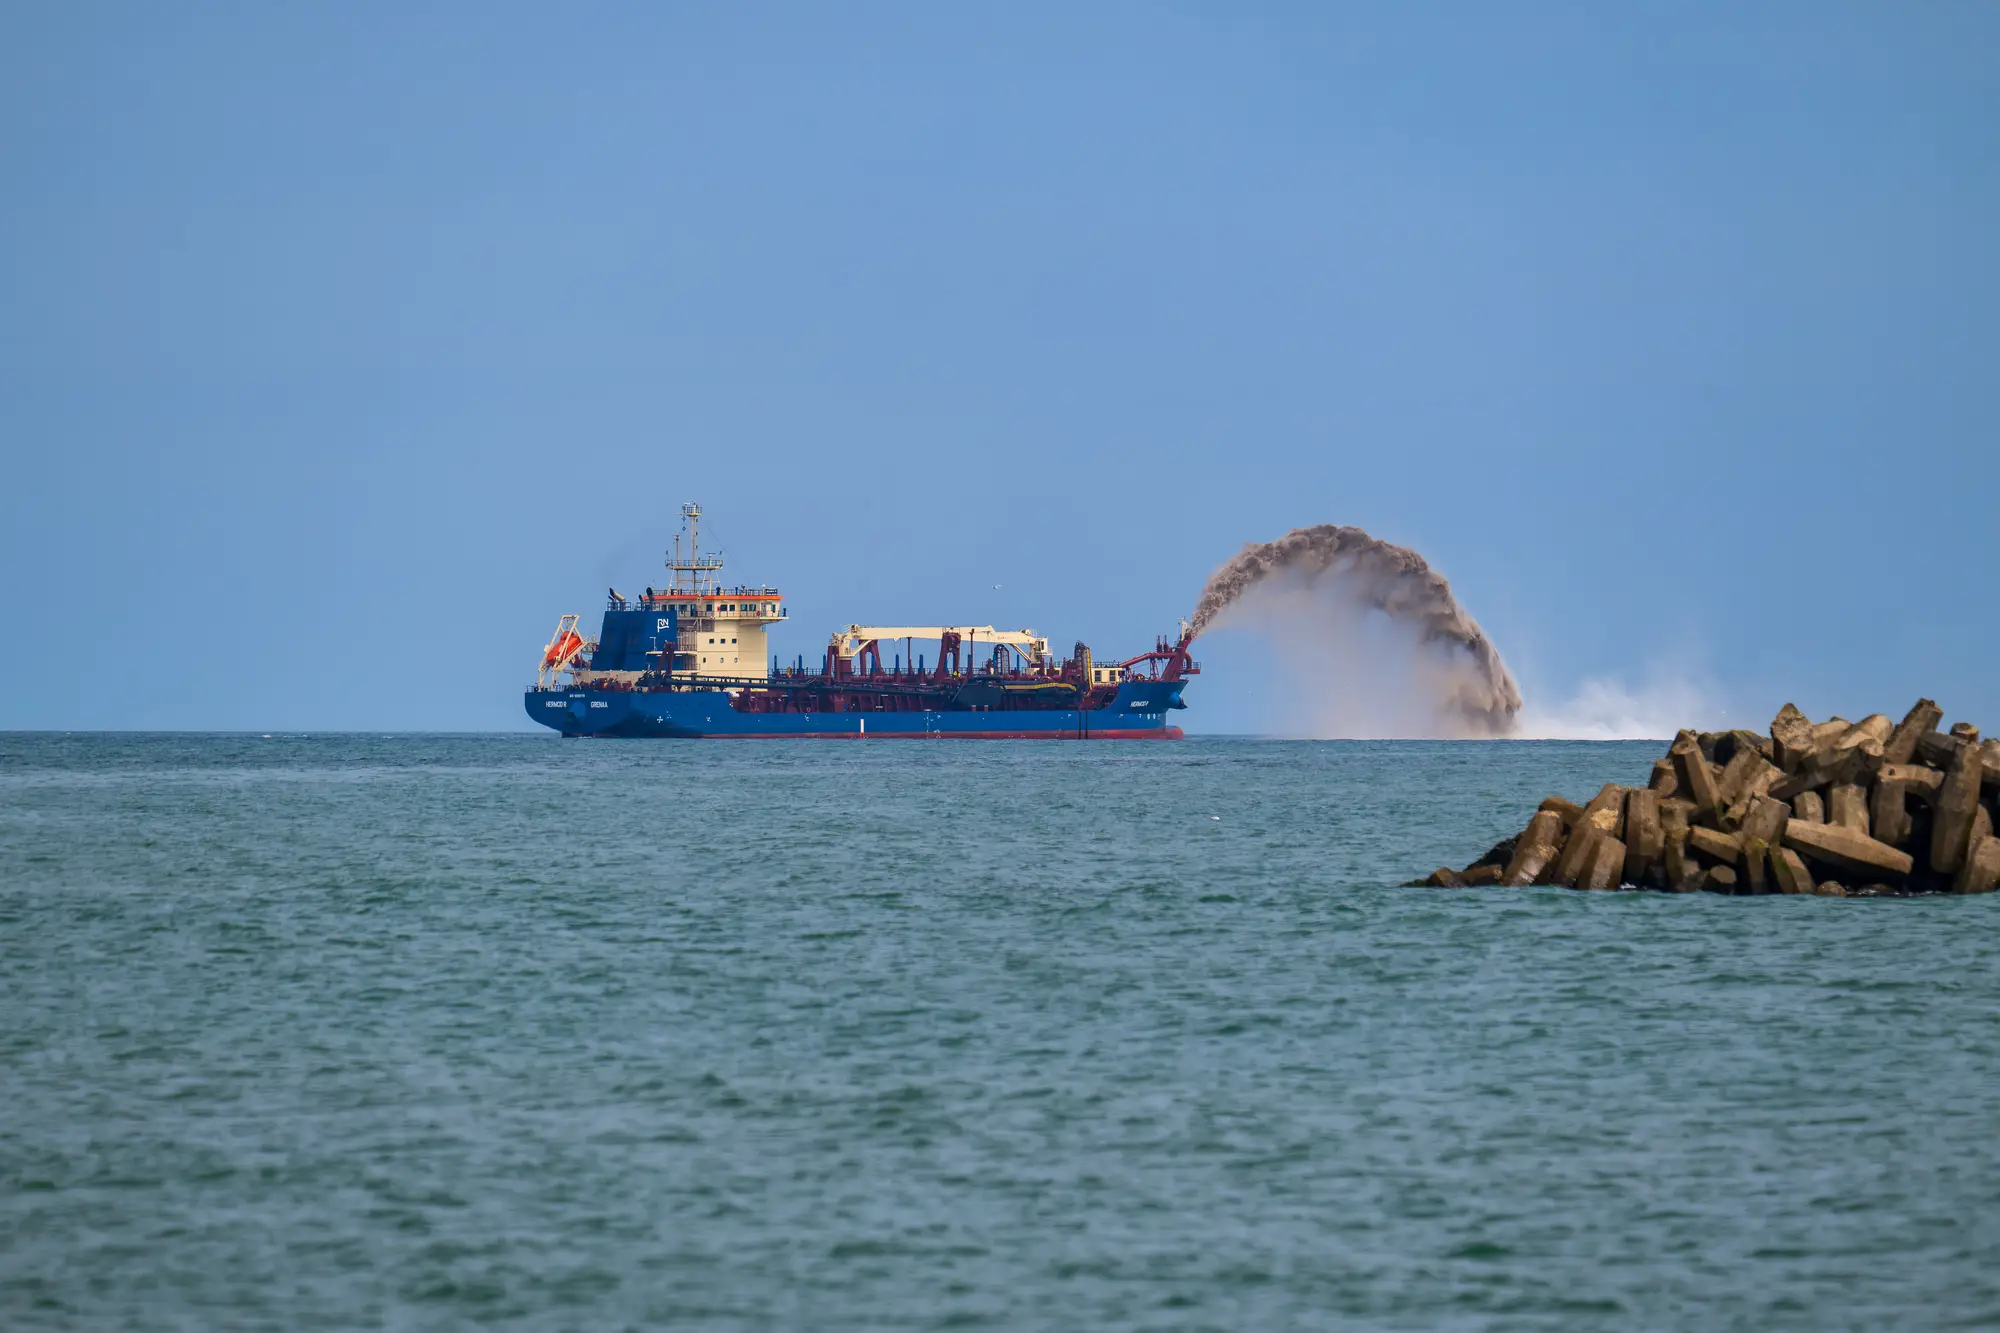
A dredger spraying sand in an arc offshore, beyond a breakwater of concrete blocks

The register, step by step

StepReleases and site visitsWith Port Monitoring
Learning that something was builtYou read the operator's release or the annual report, and trust the wording.Each quarter you get the polygons that changed between two passes, whatever the release says.
Sizing the reclamationYou take the area from the master plan or the announcement, which is the planned area.The reclaimed area added since the last pass comes as a polygon you can measure in your own GIS.
Following the berth lineA visit, a photo from the quay, or a statement that the extension is open.The berth line extension shows up on the change layer, with the two images it came from.
Watching spoil disposalDredging contractors report volumes placed, to whoever asks them.Growth of the spoil ground, where it shows from above, appears as its own change polygon.
Proving it for the registerA note in the register citing a press release, with a date.A before and after image pair for the pass, dated, that goes straight into the memo or board pack.
What the change meansYou judge the phase, the delay and the risk from what you know of the project.You do the same, with the change layer in front of you.
Still yours: The phasing call, any completion date, the contract view, and anything that needs a hydrographic or topographic survey.

What you get each quarter

  1. GeoJSON / map layer

    Change layer

    Polygons for reclaimed area added, berth line extended and spoil ground growth between the latest pass and the one before. Opens in your GIS or drops into a dashboard that takes a map layer.

    Ledger rowSizing the reclamationFollowing the berth lineWatching spoil disposal

  2. Image pair

    Before and after image pairs

    The two passes behind each change, side by side, so you can see the change for yourself. This is the evidence row in the ledger.

    Ledger rowProving it for the register

  3. First pass

    A standing baseline

    Your first pass sets the baseline. Every later quarter is compared with the one before.

    Ledger rowLearning that something was built

Start to first delivery

You give us the port or project boundary. We take a high-resolution pass each quarter and compare it with the last clear one. You get the change layer and the image pairs.

  1. Boundary in

    The port or project area you want watched, as an outline or a name we can place.

  2. Quarterly pass

    A high-resolution satellite pass over the boundary, RGB, at 0.5 to 2 m.

  3. Compared with the last pass

    The new pass is set against the prior one and the changed ground is cut into polygons by type: new fill, quay structure, spoil pile.

  4. Layer and pairs out

    The change layer and the before and after pairs reach you, in step with your quarterly review.

Limits

  • Only from the first pass

    History starts when monitoring starts. There is no baseline before it, and we don't reconstruct one.

  • A cloudy quarter is a skipped pass

    If the port is under cloud, that pass is skipped and the next clear one becomes the comparison point. A skipped pass is not filled with an estimate.

  • Resolution floor

    At 0.5 to 2 m, a pixel is between half a metre and two metres across. New reclaimed ground, a quay line and a spoil heap show. A single bollard, a crane rail or a fine detail of a revetment does not.

  • Above the waterline

    It sees what shows from above. Dredging under water leaves no trace in an RGB image, so the dredge footprint and depths are not measured. Spoil ground growth shows only where the material is visible, such as on land or in shallow clear water.

  • Change, not plans

    It flags the type of structure that changed. It does not read construction plans or name contractors.

  • Not a survey

    This is an imagery read. It gives no volumes, depths or survey-grade measurements.

Who it's for

For

  • Port development analysts keeping a register of berth, reclamation and dredging projects
  • Planning and strategy teams at a port authority checking their own capital projects
  • Analysts at funds, lenders, shipping lines and consultancies watching another operator's expansion

Not for

  • Bathymetric or hydrographic survey, dredge volumes or channel depths
  • Engineering measurement that has to stand up as a survey
  • Predicting completion dates or percent complete
  • Day-to-day vessel or cargo tracking

Questions before you start a project

Can you tell what's being built, not just that something changed?

It flags the type of change: new fill, quay structure, spoil pile. It does not read construction plans or name the contractor.

Does this replace a survey?

No. It is an imagery read of change on the surface. Depths, volumes and anything that needs a survey stay with a surveyor.

What if a quarter is cloudy?

That pass is skipped. The next clear pass becomes the comparison point, and nothing is estimated for the gap.

How far back does the history go?

From your first pass. We don't build a baseline from before monitoring starts.

How do we check it against what we know?

Pick a port where you know the state of the project and start a pilot area there. Compare the layer and the image pairs with your own register entry and what you've seen.

Will it open in our GIS?

It comes as GeoJSON or a map layer, so it opens in a standard GIS or a dashboard that takes one. We don't write into your register.

Can we watch a port that isn't ours?

The layer is built from satellite imagery of the port you name. Whether you own it or watch it from outside doesn't change what the pass shows.

Who owns the imagery and the results?

Ownership and licence terms are agreed in writing when you start. If your legal team needs them earlier, ask.

How is it bought and priced?

We don't publish a price here. Tell us what's on your register and we'll come back with a quote for it.

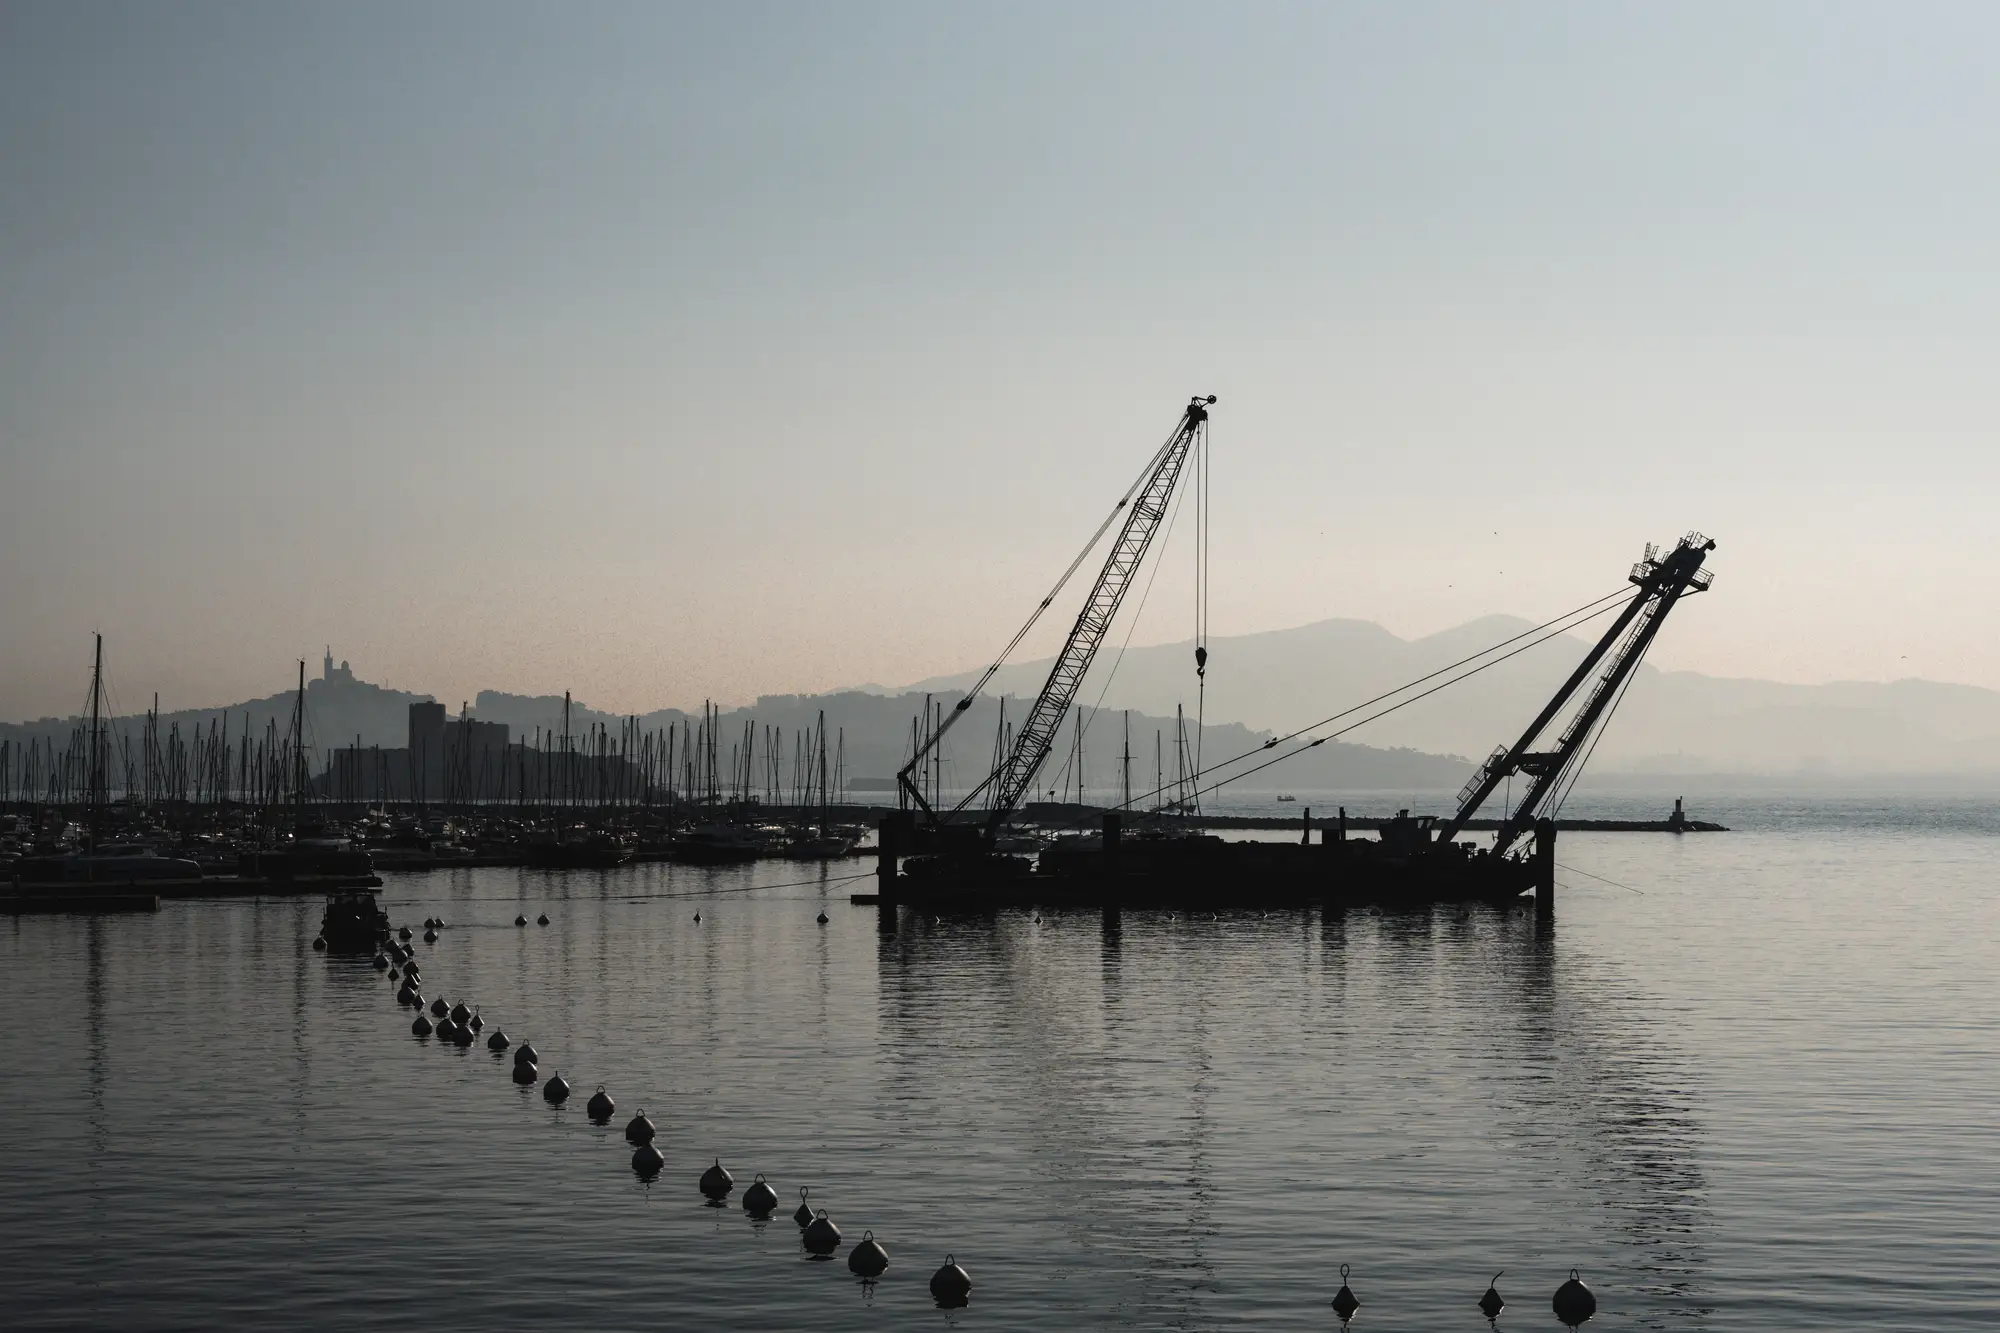
A crane barge moored in a harbour at dawn, with a line of buoys in the foreground

Start tracking your port.

Name a port or a project on your register. We'll tell you what a quarterly pass can show there.